The same familiar faces dominate the top 25 container port rankings in North America. Nevertheless, it should be noted that there have been some significant shifts following the collapse of Hanjin and the aftermath brought upon the shipping industry as a whole (see Table 1 below). We also note the overall aggregate increase in exports with regards to the USA.
Table 1: Top 25 Ports in North America 2016
| Rank | North American Port | Location | Coast | 2016 North American Market Share | 2015 | 2016 | YOY % Change |
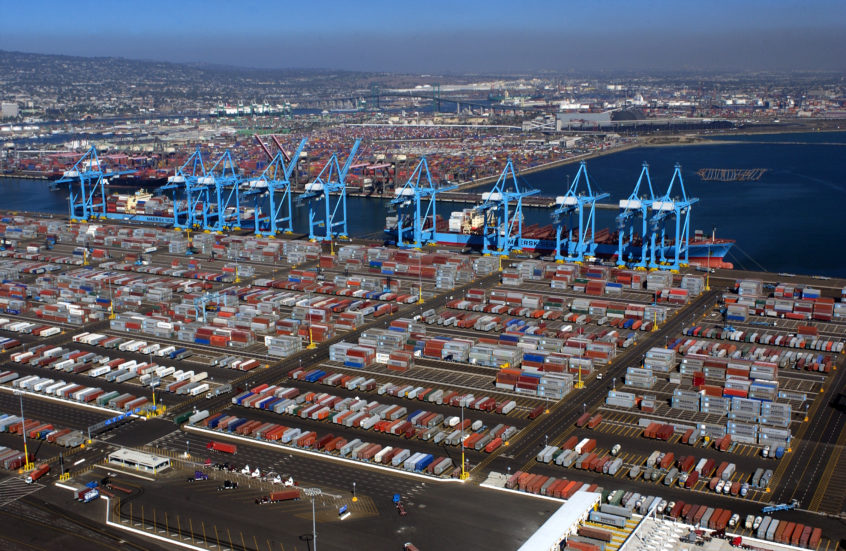
| 1 | Los Angeles | Calif. | West | 10.00% | 1,493,035 | 1,625,151 | 8.80% |
| 2 | New York-New Jersey | N.Y.-N.J. | East | 8.00% | 1,329,704 | 1,300,295 | -2.20% |
| 3 | Long Beach | Calif. | West | 7.90% | 1,286,252 | 1,277,474 | -0.70% |
| 4 | Georgia ports | Ga. | East | 7.60% | 1,213,013 | 1,225,855 | 1.10% |
| 5 | Vancouver, British Columbia | Canada | West | 6.80% | 1,066,034 | 1,100,686 | 3.30% |
| 6 | Virginia ports | Va. | East | 5.80% | 925,114 | 933,675 | 0.90% |
| 7 | Seattle-Tacoma* | Wash. | West | 5.90% | 841,797 | 951,605 | 13.00% |
| 8 | Houston | Texas | Gulf | 5.70% | 918,112 | 916,492 | -0.20% |
| 9 | Oakland | Calif. | West | 5.00% | 707,928 | 810,661 | 14.50% |
| 10 | South Carolina ports | S.C. | East | 4.50% | 721,828 | 727,994 | 0.90% |
| 11 | Manzanillo | Mexico | West | 4.40% | 693,609 | 713,486 | 2.90% |
| 12 | Montreal, Quebec | Canada | East | 3.70% | 605,213 | 603,523 | -0.30% |
| 13 | Jacksonville | Fla. | East | 2.90% | 486,321 | 476,255 | -2.10% |
| 14 | Port Everglades | Fla. | East | 2.60% | 415,881 | 417,871 | 0.50% |
| 15 | Miami | Fla. | East | 2.20% | 363,235 | 361,042 | -0.60% |
| 16 | Altamira | Mexico | Gulf | 1.90% | 286,619 | 303,934 | 6.00% |
| 17 | Veracruz | Mexico | Gulf | 1.70% | 251,724 | 270,754 | 7.60% |
| 18 | New Orleans | La. | Gulf | 1.60% | 252,106 | 261,260 | 3.60% |
| 19 | Baltimore | Md. | East | 1.40% | 203,439 | 225,776 | 11.00% |
| 20 | Lazaro Cardenas | Mexico | West | 1.40% | 185,481 | 220,863 | 19.10% |
| 21 | Halifax, Nova Scotia | Canada | East | 1.20% | 189,855 | 200,434 | 5.60% |
| 22 | Delaware River ports | Del.- N.J.-Pa. | East | 1.20% | 186,366 | 186,754 | 0.20% |
| 23 | Prince Rupert, British Columbia | Canada | West | 1.00% | 153,615 | 166,291 | 8.30% |
| 24 | Palm Beach | Fla. | East | 0.80% | 134,164 | 128,860 | -4.00% |
| 25 | Mobile | Al. | Gulf | 0.70% | 100,811 | 117,520 | 16.60% |
Source: www.joc.com
Top of the Heap
The ports that had dominated the rankings in 2015 largely retained their top spots despite all the upheavals that have been taking place in the industry. Below that, the other ports faced some changes in their placement. The two leading factors behind these changes were the collapse of Hanjin in 2016 and the growth in US exports.
The top rankings are taken by Los Angeles, Long Beach, and New York-New Jersey respectively. This is not too much of a surprise when one considers the fact that these are locations that are surrounded by enormous urban areas that are global economies in themselves.
Vancouver is still leading the Canadian contingent. The same can be said for Manzanillo with reference to Mexico. It is striking to note that the top ports in the USA and Canada retained roughly the same amount of total trade in 2016 as was in 2015. Nevertheless, there were still some notable changes including how Houston overtook Manzanillo to capture 8th place in the rankings. This came about because Houston experienced a 7.3% increase in imports on a year over year basis. At the same time; Houston experienced a 2.9% increase in exports; hence making it a rather busy port.
Rapid Growth and Decline
Los Angeles was the fastest growing port when total trade was taken into account. It had an 11.4% year on year rise when compared to the statistics for 2015. The next big performer was New Orleans with its 10.7% growth rate. In the third place for growth was Oakland with a reading of +9.5%. The data for those changes was compiled by PIERS in conjunction with the Journal of Commerce. Other data sources include various port authorities and transportation agencies across the main players in North America (USA, Canada and Mexico).
It is useful to delve into some of the underlying reasons for the growth for certain ports. For example: Oakland had a 14.5% increase in exports. The perceptive industry watchers might link this to the fact that US overall exports experienced a year over year growth rate of 3.3%. This was matched by an overall 5.1% increase in imports. It is therefore not surprising that a port like Oakland was able to beat others to 10th place. Actually Oakland replaced Charleston (another USA port) at the top of the rankings. Mobile snapped up the last place in the top 25 by bumping off Boston. This was due to its increment of 16.6% in exports which had a positive effect on its overall trade.
The import side also had interesting statistics. The top ports in terms of year on year import growth were:
- Halifax – 16.8%
- Altamira – 11.7% (This also happens to be Mexico’s second-largest Gulf port)
- Los Angeles – 12.4%
- Virginia – 10.2%
Impact of the Hanjin collapse
The fall of Hanjin inevitably affected the fortunes of certain ports in North America. For example; Wilmington (NC) experienced a 17.8% fall in the number of imports. This meant that a port that was the 23rd on that particular list of imports fell to the 25th place. Long Beach is another notable location since that is where Hanjin used to operate its Pier T container terminal. As a consequence; Long Beach experienced a 6.3% decline in imports. That did not stop it from sticking to the 2nd position when it came to the imports rankings. The least of losers in the imports stakes goes on to include:
- Vancouver (Canada)
- New York (USA)
- New Orleans (USA)
- New Jersey (USA)
Such results may be at odds with the increase in exports but that can be explained by the overall USA trade balance where the country tended to export more than before. That could be feeding into the top growth ports in the export arena including:
- Lazaro Cardenas – 19.1%
- Oakland – 14.5%
- Seattle-Tacoma – 13.0%
- Baltimore – 11.0%.
As a consequence; Seattle-Tacoma took over 7th place on the export rankings. The 17th spot was taken by Veracruz. This was due to a 7.6% increase in exports which meant that it could bump New Orleans off that spot.
Despite some of the great news, it is notable that 8 out of the 25 top container ports recorded a decline in exports. The biggest fall was by Palm Beach at 4%. Other notable declines include:
- Wilmington (North Carolina)
- Miami
- Jacksonville
- Montreal
- Houston
- New York-New Jersey
In the final analysis; the ratio of imports to exports was 62.5:37.5. The same statistic in 2015 read 62:38.
It is clear that the big players still have a place on top of the list but that there are some changes throughout the industry. The collapse of Hanjin was a significant event that affected ports. Likewise; the overall growth in exports from the USA was bound to have some effect on the top 25 rankings.
Sources: www.joc.com, www.gtfleet.com